
At Sendx.io, we provide a heatmap feature that allows you to gain insights into the performance of your campaigns. In this guide, we will walk you through the process of accessing the heatmap and understanding the data it provides. Let's get started!
Step 1: Accessing the Campaign Report
After sending out your campaign, log in to your Sendx account and navigate to the section that displays your sent campaigns. Hover over the campaign you want to analyze and click on Actions > View Report.

Step 2: Heatmap Section
In the 'Performance' tab, scroll down and you will find the Heatmap section. You will have the option to view it larger or share it.

Step 3: Exploring the Heatmap
Take a moment to study the heatmap and observe the color-coded areas. The colors indicate the engagement levels in different regions, allowing you to identify hotspots where your campaign received the most interaction. Cooler colors represent areas with less engagement.
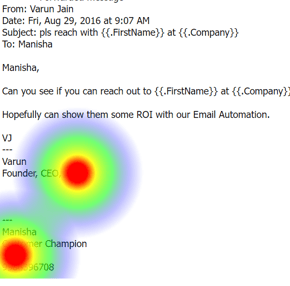
With our heatmap feature, you can easily view and interpret the performance of your campaigns. Accessing the campaign report and selecting the heatmap option, you can gain valuable insights that inform your marketing strategies.
We hope this guide has been helpful to you. If you have any additional questions, please let us know.